 Land and ocean temperature departure from average January-December 2018 (°C) (with respect to a 1981–2010 base period). National Centers for Environmental Information
Understanding How Climate Change Affects Nebraska and Agriculture
by Tyler Williams, Extension Educator
Climate change is a challenging subject to understand, discuss openly and interpret how it will influence our daily lives.
Global Warming or Climate Change
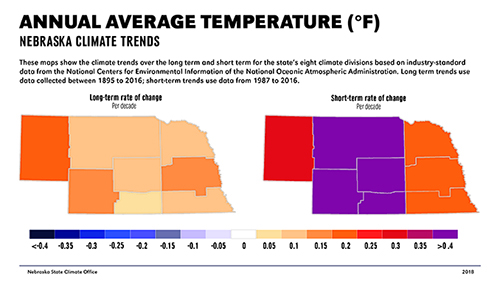 ANNUAL AVERAGE TEMPERATURE (°F) - Nebraska Climate Trends. These maps show
 the climate trends over the long and short term for the state's eight climate divisions
based on industry-standard data from the National Centers for Environmental Information
of the National Oceanic Atmospheric Administration. Long-term trends use data
collected between 1895 to 12016; short-term trends use data from 1987 to 2016.
Source: Nebraska State Climate Office
The terms “global warming” and “climate change” are commonly used interchangeably, but people often have different responses to each term. Essentially, global warming is exactly what it says: the globe is warming. This does not mean every town or county in the world is warming, but, as a whole, the globe is warming.
The average temperature of the globe in 2018 was 1.42°F above the last century average, making it the 42nd consecutive year the global average land and ocean temperature was above the 20th century average. The climate has changed many times in the past, but this rate of change is the main cause for concern, limiting our ability to adapt.
The term climate change is the term of choice used by many people when describing the impacts from a warming world. This does a better job of being able to describe the potential local impacts. For example, warming temperatures in one area may influence the upper level jet stream pattern, which may cause a cool and wet pattern to persist in another area. Using the term climate change can include more than “warming temperatures,” which is a more accurate way to describe how changes in climate may impact your area. The scientific community continues to learn more about these feedback mechanisms and how the earth will respond.
Why the Confusion on Climate Change?
The Yale Program on Climate Change Communication conducts surveys across the country to get a handle on what people think about climate change and why. According to their 2018 poll, 64% of Nebraskans think global warming is happening (6% below national average), with a state high of 72% in Lancaster County, to a state low of 53% in Lincoln County. Only 51% of Nebraskans think it is caused mostly by human activities, with a state high of 66% in Lancaster and Douglas Counties and a state low of 44% in Lincoln County. This split on what is causing the changes — or even believing it to be true — often creates some anxiety or dismissiveness when discussing the issue.
Getting accurate and non-biased climate change information can be a challenge. Many people have a news source of choice, which likely only provides one side of the climate change story and it probably aligns with the beliefs of its largest viewership. People also have a tendency to seek out the information they want to be true or information that aligns with their beliefs.
Finding reputable, non-biased sources is the key when trying to analyze climate change information and learn more about this topic.
Latest Climate Science
At the end of 2018, the U.S. Global Change Research Program released the 4th National Climate Assessment. This report interprets the findings of the latest climate science, analyzes the effects of global change and analyzes current trends and projections. The report is broken down into chapters and Nebraska is in the Northern Great Plains chapter, which focuses on water, agriculture, recreation & tourism, energy and indigenous peoples. The full report can be found at https://nca2018.globalchange.gov.
Trends: Nebraska’s climate has warmed slightly over the last century by about 1.6°F since 1895; however, the rate of warming has nearly doubled for the last 30 years, compared to the long-term trend. This recent warming trend has been most notable in the summer and fall seasons, with a noticeable cooling trend during the winter. The hidden detail in the data is the consistent increase in minimum temperatures, which is outpacing the rise in maximum temperatures by a factor of two.
The precipitation trends in Nebraska are highly variable in time and location. On average, every 25 miles you go west in Nebraska, you lose one inch of annual precipitation, so when we say Nebraska is getting “wetter” (1.3-inch increase in 20th century), it means something completely different in Scottsbluff compared to Falls City. Seasonal differences are also quite important. Over the last 30 years, our spring precipitation has been increasing at a rate of 0.9 inches per decade and is a relatively consistent trend across the state.
Projections: Models are used to help project what the future of our climate looks like. The projections in Nebraska for the next 75 years are similar to the trends we have seen over the last 30 years, with a few exceptions. It is projected to have longer growing seasons, warmer summers and more extreme hot days (current trend is decreasing). There is also an expectation to continue to see more precipitation; however, this is projected to come in less frequent, heavier events, so much of it may runoff causing other challenges and reducing infiltration into the soil. Even though there is this expected increase in precipitation, the increase in temperatures, especially during the growing season, would likely increase evaporation and put stress on water resources.
There are many other potential impacts, depending on the scale of the projected changes. The complexity of our earth and the many feedback mechanisms, combined with the unknown of future human activities and technological advances, limit the ability to say for certain what we could expect. As we all know, our highly variable, often unpredictable climate means we can still get extremes far from the general trend. Managing those extremes will be the key going forward.
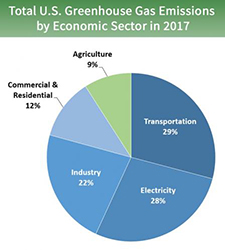 Total US Greenhouse Gas Emissions by Economic
 Sector in 2017. Environmental Protection Agency
Agriculture and Climate Interaction
Our climate can influence nearly every aspect of our lives, but when it comes to agriculture, the two are deeply connected. Our climate determines what types of crops we grow, types of cattle breeds to use, seasonal precipitation and temperature patterns, common pests to expect, among other influences. Seasonal variations (i.e. weather) often determine how successful we are in any given year. Managing these deviations and “extremes,” is the key to successful agricultural production in a challenging climate.
Climate Impacts On Agriculture: The projected changes mentioned earlier can influence agriculture, but during a 2017 and 2018 “Scenario Planning” project between South Dakota State University Extension and Nebraska Extension, faculty visited with cropping system and beef system stakeholders to determine which climate “scenarios” were most challenging. As you can imagine, this changed by location and individual operation, but there were some common themes. For cropping systems, the biggest challenges were wet and cold springs and falls. When talking with beef stakeholders, wet winters and dry summers were the most challenging.Many of these challenging scenarios have actually played out over the past year, and the climate projections predict many of these will become more common in the future. It is important to take a look at how your operation “faired” during these conditions and take note of what worked and what didn’t in order to develop a plan based on certain scenarios. Scenario planning is used in many industries and it may be what is needed in agriculture moving forward. More information on the Scenario Planning project and impacts/management strategies can be found at https://weather-ready.unl.edu.
Agriculture Impacts On Climate: It is easy to see how our climate impacts agriculture, but is not easy to know how agriculture impacts our climate. Many things impact our climate; such as building infrastructure, urbanization, vehicle emissions, energy use and many, many other ways. Agriculture is only a piece of the “pie” when it comes to impacting our climate. Greenhouse gases — such as carbon dioxide (CO2), methane (CH4), nitrous oxide (N2O), ozone, water vapor and others — impact our climate by “trapping” heat near the earth’s surface. Without these gases, the earth would be about 59°F cooler, however, there is a fine balance to maintain a constant temperature. There are many other human and natural factors that influence our climate, but much of the attention is placed on greenhouse gases.
In 2010, 24% of global emissions were from the agriculture, forestry and other land-use sector. This 24% includes the emitted greenhouse gases, but does not include the CO2 that ecosystems remove from the atmosphere by sequestering carbon in biomass, dead organic matter and soils, which offset approximately 20% of emissions from this sector. In 2017, the agriculture sector contributed approximately 9% of all U.S. greenhouse gas emissions (does not include sequestered CO2). The contribution to this ag sector comes from crop cultivation (49%), livestock (44%) and fuel combustion (7%).Agriculture has its largest impact when looking at gases other than CO2. CO2 emissions are quite low and the overall balance is even smaller when taking into account the carbon dioxide sequestered by plants. CH4 and N2O are a different story. Agriculture contributes (as of 2016) 77% of the U.S. N2O emissions and 35% of U.S. CH4 emissions. These gases have a stronger “global warming potential” (based on a ratio compared to CO2) than CO2 because of the enhanced heat-trapping properties and extended life-span of N2O (lasts an average of 114 years). Most of the N2O comes from agricultural soil management and much of the CH4 comes from enteric fermentation — aka cow burps — and from anaerobic fermentation.
There are many agricultural practices (i.e. no-till farming, irrigation scheduling, etc.) that can reduce economic losses caused by our weather and climate. Many of these losses are often the result of losses of soil or nutrients to the environment. Much attention has been placed on reducing these losses by ag businesses, farmers, universities and many others, with the goal of having an economically, socially and environmentally sustainable agricultural system.
Sources:
- National Centers for Environmental Information, www.ncdc.noaa.gov
- Nebraska’s Changing Climate — CropWatch, Dec. 2018, https://cropwatch.unl.edu/2018/nebraska-changing-climate
- NOAA Climate.gov, www.climate.gov
- U.S. Environmental Protection Agency — Greenhouse Gas Emissions, www.epa.gov/ghgemissions
- Yale Program on Climate Change Communication, http://climatecommunication.yale.edu
Reference to commercial products or trade names is made with the understanding that no discrimination is intended and no endorsement by the University of Nebraska–Lincoln is implied. The information on this Web site is valid for residents of southeastern Nebraska. It may or may not apply in your area. If you live outside southeastern Nebraska, visit your local Extension office